There is nothing more frustrating than launching a beautiful new website, running it through Google PageSpeed Insights, and seeing a big red number: 42/100.
That number isn't just a blow to your ego; it is a direct hit to your revenue. Amazon found that every 100ms of latency cost them 1% in sales. If your site takes 5 seconds to load on 3G, you are bleeding money.
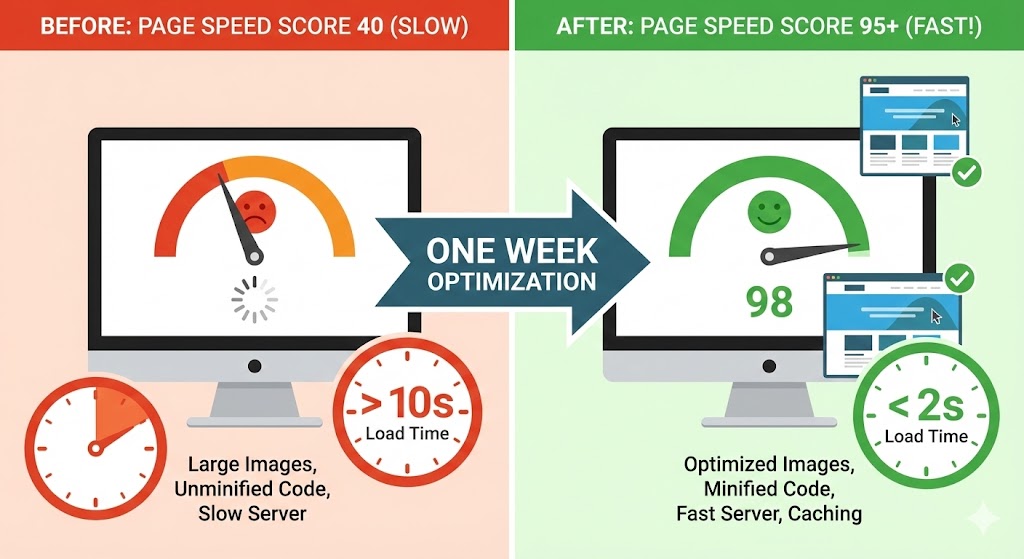
The good news? Moving from the red zone (0-49) to the green zone (90-100) is usually a matter of engineering, not magic. Here is the exact checklist we follow to supercharge a website in one week.
Day 1-2: The Low-Hanging Fruit (Images)
Images are the "heaviest" part of 90% of websites. If your designer uploaded 4MB PNGs directly from Photoshop, your speed score is dead on arrival.
The Fix:
- Format: Convert everything to AVIF or WebP. These formats are 30-50% smaller than JPEG.
- Sizing: Don't load a 4000px wide image into a 300px wide box. Use "Responsive Images" (srcset) to serve the exact size needed.
- Lazy Loading: Add loading="lazy" to every image below the fold.
Day 3-4: Eliminate "Render-Blocking" Resources
When a browser loads your site, it reads the HTML from top to bottom. If it hits a massive JavaScript file in the <head>, it pauses everything to download and read that file. This is "Render-Blocking."
The Fix:
- Defer JavaScript: Add the defer or async attribute to your script tags. This tells the browser, "Download this in the background, but show the website text now."
- Critical CSS: Inline the CSS needed for the top of the page (the header and hero section) directly into the HTML. Load the rest of the styles in the footer.
Day 5: Browser Caching & Compression
If you aren't compressing your text files, you are sending "air" down the wire.
The Fix:
- GZIP / Brotli: Enable Brotli compression on your web server (Nginx/Apache). This compresses your text files (HTML, CSS, JS) by up to 70% before sending them.
- Cache Headers: Set your "Expires" headers to 1 year for static assets. This tells the user's browser, "Once you download this logo, keep it forever. Don't ask for it again."
Day 6: Reduce Server Response Time (TTFB)
If the browser waits 2 seconds before it even receives the first byte of data, your frontend optimizations don't matter. This is a backend issue.
The Fix:
- Database Queries: Optimize your Django/SQL queries. Remove "N+1" query problems.
- Server Caching: Use Redis to cache the results of expensive calculations so the server doesn't have to do the math every time a user visits.
Day 7: Third-Party Script Audit
Marketing tags (Facebook Pixel, Hotjar, Google Analytics, LinkedIn Insight Tag) are notorious speed killers. Do you really need 15 trackers loading before the content?
The Fix: Move these scripts to Google Tag Manager and set them to fire after the page has finished loading (e.g., on "Window Loaded" trigger), rather than on "Page View."
The Results Checklist
| Metric | Starting Value | Goal Value |
|---|---|---|
| PageSpeed Score | 40 (Red) | 95+ (Green) |
| LCP (Load Time) | 4.5s | < 1.2s |
| Total Page Size | 3.5 MB | < 800 KB |
Summary
Achieving a 95+ score isn't about removing features; it's about loading them intelligently. By prioritizing the user's experience (text and layout first) and deferring the heavy lifting (scripts and trackers), you can have a site that is visually rich and instantly fast.